During the 2024–2025 admissions cycle, the University of Chicago posted an acceptance rate of 4.48%, placing it firmly among the most selective schools in the country. But that headline number on its own doesn’t tell the full story. How is that percentage calculated? And what’s actually driving it? While UChicago does release some high-level admissions data, understanding what’s really happening requires a deeper look. This is exactly the kind of analysis we do every year to help our students approach elite admissions with clearer expectations and smarter strategy.
So where does this data come from? Most colleges and universities in the U.S. complete something called the , often shortened to the CDS. The CDS exists to standardize reporting for organizations like U.S. News & World Report, the College Board, and Peterson’s, ensuring rankings and comparisons are built on consistent information. The document covers a wide range of topics, but for our purposes, we’re going to look at a single section of : first-time, first-year admissions.
Trend Spotting: Five Years of UChicago Admissions
Before zeroing in on this most recent cycle, it helps to step back and look at the broader pattern taking shape at UChicago. Like its peer institutions, the volume of applications continues to climb while admission rates trend in the opposite direction. It’s also worth noting that UChicago only began , which limits how far back we can track these shifts.
| Year | Total Applicants | Number of Admitted Students | Acceptance Rate |
|---|---|---|---|
| 2025 | 43,612 | 1,955 | 4.48% |
| 2024 | 38,631 | 1,849 | 4.79% |
| 2023 | 37,552 | 2,039 | 5.43% |
| 2022 | 37,974 | 2,460 | 6.48% |
| 2021 | n/a | n/a | n/a |
Why This Matters: Lower yearly acceptance rates usually become a vicious cycle. We predict UChicago will continue to get even more competitive because of their ED0 option.
If you want to be competitive, you have to assume you’re one applicant among tens of thousands vying for a very limited number of spots. And you should keep in mind that a considerable portion of that applicant pool looks just as strong on paper as you do. Standing out requires more than just meeting the bar, but the stats we’ll give you should tell you what you need to achieve academically to be competitive.
C1: First-Time, First-Year Admission, Applications
Here’s the specific data breakdown for 2024-2025 admissions:
| First-Time, First-Year Applicants | Total | Admitted | Acceptance Rate | Enrolled | Yield Rate |
|---|---|---|---|---|---|
| Men | 19,195 | 1,070 | 5.57% | 955 | 89.3% |
| Women | 23,636 | 885 | 3.74% | 771 | 87.1% |
| Unknown gender | 781 | 0 | 0% | n/a | n/a |
| Total | 43,612 | 1,955 | 4.48% | 1,726 | 88.3% |
Key Takeaways for Acceptance Rates:
More women applied, but more men were admitted. There is a common misconception that it is easier to get into UChicago as a woman—this is demonstrably false.
UChicago does not supply stats for international students – although we can speculate that their acceptance rate is probably in the 1-3% range, if they are in keeping with other similar institutions.
UChicago has one of the highest yield rates, even among competitive colleges.
UChicago has always been an extremely difficult school to crack, and that shouldn’t come as a surprise to anyone at this point. What is worth paying attention to, though, is how the applicant pool breaks down by gender. They’re seeing a noticeably larger share of applications from women than men, and they’re admitting at least ~100 more men than women each year. We normally don’t see that kind of split, and schools usually try to keep the gender parity, well, paired.
C9-C2: First-Time, First-Year Profile, or Scores and Grades
UChicago has not announced a return to a test-required policy and remains test-optional for now. That said, don’t mistake “optional” for “irrelevant.” Many selective schools are paying closer attention to post-enrollment outcomes, and across higher ed, there’s growing evidence that students admitted without test scores often struggle more academically once they arrive. That trend has led some institutions to reverse course, while others, like UChicago, are still evaluating how testing fits into their admissions process. UChicago went test optional long before peer institutions, so we expect they will keep test-optional for a while, especially since they have so many avenues for admission through ED0, ED, EA, ED2, and RD. Remember, going test optional is a great way for schools to increase the number of applicants, and we know UChicago is interested in keeping that demoninator high.
Even without a mandate, we can learn a lot about how UChicago views testing by looking closely at who is choosing to submit scores and what those scores look like.
| Percent | Number | |
|---|---|---|
| Admitted and Enrolled Students Submitting SAT Scores | 49% | 850 |
| Admitted and Enrolled Students Submitting ACT Scores | 27% | 460 |
Why This Matters: Even though UChicago continues to allow students to apply test-optional, a clear majority of admitted students (76%) still opted to include scores, and those scores were extremely strong.
A majority of applicants, 76%, chose to report standardized test results despite having the option not to. And unsurprisingly, those scores landed near the top of the scale. That tells us two things: first, high-scoring students aren’t holding back, and second, submitting scores remains advantageous if your results are competitive.
Sure, you could argue that the averages skew high because only confident test-takers are submitting, but when that many students are opting in, that tells you what caliber of student they expect.
| Test | 25th Percentile | 50th Percentile | 75th Percentile |
|---|---|---|---|
| SAT Composite | 1510 | 1540 | 1560 |
| SAT Evidence-Based Reading + Writing | 740 | 760 | 780 |
| SAT Math | 770 | 790 | 800 |
| ACT Composite | 34 | 35 | 35 |
| ACT Math | 33 | 34 | 35 |
| ACT English | 34 | 35 | 36 |
| ACT Science | 33 | 35 | 36 |
| ACT Reading | 34 | 35 | 36 |
First-time, first-year students with scores in each range:
| Score Range | SAT Evidence-Based Reading + Writing | SAT Math |
|---|---|---|
| 700-800 | 97.41% | 97.88% |
| 600-699 | 2.59% | 2.12% |
| 500-599 | 0% | 0% |
| Score Range | SAT Composite |
|---|---|
| 1400-1600 | 98.82% |
| 1200-1399 | 1.18% |
| 1000-1199 | 0% |
| Score Range | ACT Composite | ACT English | ACT Math | ACT Reading | ACT Science |
|---|---|---|---|---|---|
| 30-36 | 99.57% | 99.13% | 92.83% | 98.48% | 97.39% |
| 24-29 | 0.43% | 0.87% | 7.17% | 1.30% | 2.61% |
| 18-23 | 0% | 0% | 0% | 0% | 0% |
Standardized Test Score Takeaways:
The average UChicago admit is scoring a 1550+ or 35+ on their standardized tests
Getting lower than a 1400 on the SAT or 30 on the ACT greatly reduces your chance of admission, but we’d argue that for most students less than a 1500 or 34 is where that line really starts
Even though UChicago remains test-optional, students who submit scores at the competitive end of their middle 50 typically post scores in the 1550+ or 35+ range. Yes, that’s extremely high, but we’re not saying this to intimidate you. We’re simply the messenger and are just being honest about what the data reflects. The same principle applies beyond testing, too: the academic bar is steep across the board, and GPAs are evaluated with that same level of rigor. One fun data point before we jump into the table:
the average high school GPA of all degree-seeking, first-time, first-year (freshman) students who submitted GPA was 4.97.
| GPA Range | Percentage (students who submitted scores) | Percentage (students who did not submit scores) | Percentage (all enrolled students) |
|---|---|---|---|
| 4.0 | 61.57% | 52.11% | 58.46% |
| 3.75-3.99 | 29.75% | 30.70% | 30.07% |
| 3.5-3.74 | 6.61% | 7.32% | 6.85% |
| 3.25-3.49 | 1.24% | 2.82% | 1.76% |
| 3.0-3.24 | 0.83% | 6.76% | 2.78% |
| 2.5-2.99 | 0% | 0.28% | 0.09% |
| 2.0-2.49 | 0% | 0% | 0% |
Key GPA Takeaways:
The vast majority of admitted students have a perfect or near-perfect GPA
Over half of admitted students have a perfect 4.0
Students with less than a 3.75 have significantly reduced chances at admission
UChicago has one of the more generous GPA spreads we’ve seen – but that doesn’t mean you should slack off
You can see this trend within the class rank stats as well:
| Class Rank | Percentage |
|---|---|
| Top 10th of HS graduating class | 96% |
| Top Quarter of HS graduating class | 99% |
| Top Half of HS graduating class | 100% |
| Botton Half of HS graduating class | 0% |
| Total submitting class rank | 25.49% |
Key Class Rank Takeaways:
The vast majority of admitted students are in their school’s top 10%
No admitted students were in the bottom half of their graduating class
Only a quarter of students submitted their class rank
Before we continue, the tiny slice of admits sitting in the 24–29 ACT range, or the small percentage with GPAs around 3.25–3.49, are outliers, not the norm. Those figures are not an odds calculator, and you shouldn’t read them as “great, I’ve got a shot.” In reality, we have zero insight into who those students are or why they were admitted. The students we work with who get into UChicago have basically perfect grades and scores. We say basically perfect because they might have one A minus.
At a place like UChicago, the lower GPA and ACT range could be recruited athletes, legacies, students from under-resourced schools, first-gen applicants, refugees, absolute perfect personality matches for UChicago, or once-in-a-generation talents. The point is, those exceptions exist – but they tell you almost nothing about how admissions decisions are made for the vast majority of applicants. There is around a 99% chance that you are probably not the exception.
TL;DR? For the best shot at admission, you need perfect grades and scores. That’s it.
Early Decision
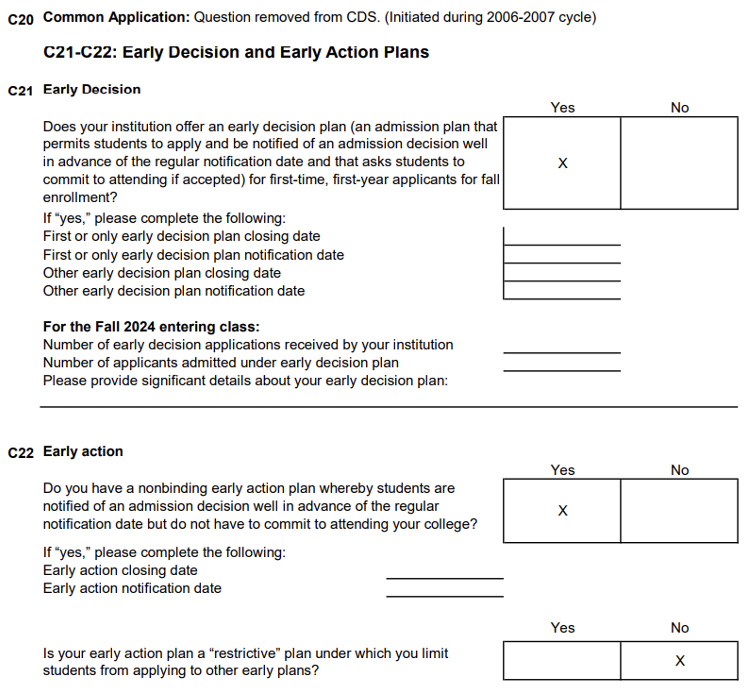
UChicago does not publish ED stats, nor do they publish their EA or ED2 stats. This is very frustrating because we can’t give you the exact data around these things, but we know from experience that UChicago accepts the a lot of their incoming class from ED/EA/ED2.
UChicago is also the premier innovator in the Early Decision space. They debuted Early Decision 0 recently. ED0 is only available to students who take a UChicago summer course. They are able to apply to UChicago “ED0” and find out their result before the ED1 submission deadline on November 1st. The idea of “being done” early has undeniably driven traffic to UChicago’s summer programs, and has also contributed to higher application numbers.
Waitlist
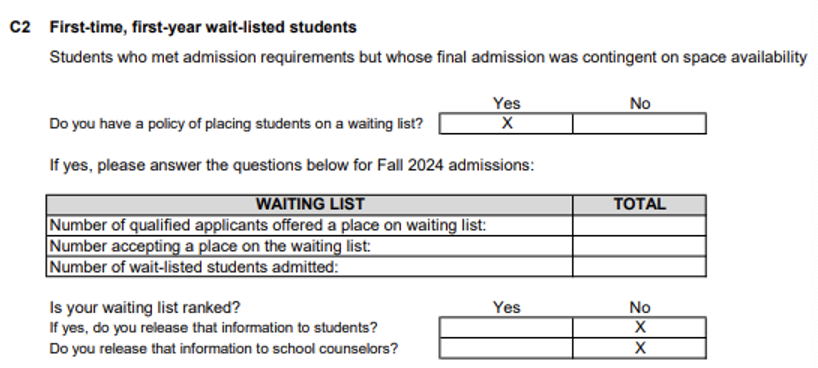
Shocker! They don’t publish waitlist data either! We really wish they did. We will say, from experience, that moving off the waitlist at UChicago is undeniably challenging, but it is certainly within reach. Every year, we work with students who successfully turn a waitlist decision into an acceptance. If you need support crafting a strong waitlist letter or strategy, that’s exactly what we do.
Considerations
Now we’re onto the most subjective part of the CDS, the considerations. Some of these are concrete and easy to measure, like GPA and test scores, while others fall into a much fuzzier category of nonacademic qualities that are far harder to define or quantify.
| Academic Factors | Very Important | Important | Considered | Not Considered |
|---|---|---|---|---|
| Rigor of secondary school record | X | |||
| Class rank | X | |||
| Academic GPA | X | |||
| Standardized test scores | X | |||
| Application Essay | X | |||
| Recommendation(s) | X |
Key Takeaways for Academic Factors:
The rigor of your classes, recommendations, and essays are very important to UChicago, which does not surprise us
Class rank and test scores are where we expect for a test-optional school, but GPA is ranked lower than we’d think
| Nonacademic Factors | Very Important | Important | Considered | Not Considered |
|---|---|---|---|---|
| Interview | X | |||
| Extracurricular activities | X | |||
| Talent/ability | X | |||
| Character/personal qualities | X | |||
| First generation | X | |||
| Alumni/ae relation | X | |||
| Geographical residence | X | |||
| State residency | X | |||
| Religious affiliation/commitment | X | |||
| Volunteer work | X | |||
| Work experience | X | |||
| Level of applicant's interest | X |
Key Takeaways for Nonacademic Factors:
UChicago does not track demonstrated interest
An interview at UChicago will not sway your admissions decision
Focusing on extracurriculars is the best use of your time as an applicant
Some of the nonacademic factors on UChicago’s list are relatively straightforward, like “geographic background,” which is easy for an admissions office to identify. Others are much murkier – think qualities like “character” or “talent,” which don’t come with a checklist or scoring guide. Those traits are usually pieced together from essays, recommendation letters, and the overall tone of an application. Now, you can be thoughtful and strategic in how you present yourself, but there’s no way to perfectly game that system.
Let’s talk about extracurriculars for a second. For truly competitive applicants, it’s never about shallow participation. The students who rise to the top aren’t just members of a few clubs or captains of a team because they think they should be. They’ve built focused, often quirky pursuits that clearly connect to their intellectual interests and future goals. Depth, originality, and sustained commitment matter a lot here, especially at a school that values curiosity and unconventional thinking. And helping students develop standout profiles is exactly what we do, year after year!
Conclusion
There’s no question that UChicago sits firmly in the ultra-selective category. That’s not exactly breaking news, but now you at least have clearer reference points and expectations as you think about what it takes to be competitive in their applicant pool.
At the same time, statistics can only tell part of the story. Numbers don’t fully capture what UChicago prioritizes, and they certainly don’t define you as an individual applicant. When we work with students, whether they’re legacies, applying Early Decision, being recruited, or coming in through Regular Decision, our strategy is always personalized. Your interests, strengths, and goals drive the plan. There’s no universal formula or guaranteed pathway into UChicago. Still, there are smart, intentional steps you can take to put yourself in the strongest possible position, and we can help you with that.
One way to increase your odds? Working with college consultants who are experts in the field and have a high rate of success getting students into UChicago.
We help countless students gain admission to top universities every single year – reach out to us today to get started.