During the 2024–2025 admissions cycle, USC reported an acceptance rate of 9.81%, making it the most selective in the school’s history. But that top-line percentage doesn’t actually explain very much on its own. USC does release some admissions data publicly, but to really understand what’s happening, you have to dig deeper. That’s exactly what we do every year to help students approach selective admissions with realistic expectations and an intentional game plan.
That’s where the CDS comes in. Like most U.S. colleges and universities, USC completes the , a standardized reporting tool used by organizations such as U.S. News & World Report and the College Board. The CDS includes a wide range of institutional data, but for our purposes, we’re going to focus on section C of : first-time, first-year admissions.
Trend Spotting: Five Years of USC Admissions
Before zooming in on the most recent cycle, it’s helpful to take a step back and look at USC’s broader admissions pattern. And applications are booming at USC.
| Year | Total Applicants | Number of Admitted Students | Overall Acceptance Rate* |
|---|---|---|---|
| 2025 | 82,027 | 8,050 | 9.81% |
| 2024 | 79,936 | 7,998 | 10% |
| 2023 | 69,062 | 8,304 | 12.02% |
| 2022 | 71,031 | 8,884 | 12.51% |
| 2021 | 59,712 | 9,618 | 16.1% |
*Denotes our own calculation based on the raw data
Why This Matters: A trend towards more applications combined with fewer available spots (due to a moderate yield rate, amongst other factors) means admission is only getting more competitive, and there’s no sign that trend is slowing down.
When you apply to USC, you’re competing against tens of thousands of applicants who look impressive on paper. Strong grades and solid test scores (if submitted) are the starting point, not the differentiator. Standing out requires focus, intention, and a profile built around depth rather than box-checking.
C1: First-Time, First-Year Admission, Applications
Let’s take a look at this year’s breakdown:
| First-Time, First-Year Applicants | Total | Admitted | Acceptance Rate* | Enrolled | Yield Rate* |
|---|---|---|---|---|---|
| Men | 36,810 | 3,928 | 10.67% | 1,623 | 41.3% |
| Women | 45,190 | 4,117 | 9.11% | 1,866 | 45.32% |
| Another Gender | 27 | 5 | 18.52% | 0 | 0 |
| Total | 82,027 | 8,050 | 9.81% | 3,489 | 43.3% |
*Denotes our own calculation based on the raw data
Key Takeaways for Acceptance Rates:
More women apply and are accepted than men, but the acceptance rate for women is lower
USC has work to do on their yield rate if they want to become a truly competitive school
USC’s selectivity might come as a shock to parents who went to college in the 90s, but we’ve seen how hard they’ve worked to become a highly popular and sought-after school. USC is not a safety for anyone, and for 99% of students, it’s not a target either. It’s firmly a reach school, and it will be for the foreseeable future. However, compared to peer institutions with a sub 10% acceptance rate, their yield is very low.
Standardized Test Scores
USC currently allows students to apply , but that doesn’t mean you shouldn’t submit your scores. Across higher education, schools are paying closer attention to post-enrollment outcomes, and many have found that students admitted without scores often struggle more once they arrive on campus. That trend has led some institutions to reinstate testing requirements. For now, USC remains test-optional, but as you’ll see, strong scores will help you immensely.
Even in a test-optional environment, the data tells a clear story. Examining how many students choose to submit scores, and how strong those scores are, offers meaningful insight into what USC values.
Breakdown of enrolled students who submitted test scores:
| Percent of Enrolled Freshmen | Number of Enrolled Freshmen | |
|---|---|---|
| Submitting SAT Scores | 30% | 1,044 |
| Submitting ACT Scores | 12% | 426 |
| Total Submitting Scores* | 42% | 1,470 |
*Denotes our own calculation based on the raw numbers
Why This Matters: Almost half of enrolled students submitted test scores, indicating that USC takes them seriously even though they aren’t required.
A decent chunk of students who ultimately enroll at USC still chose to include SAT or ACT results, even though submitting scores wasn’t required. Unsurprisingly, the reported scores were high! That sends a pretty clear message: applicants with strong test results are comfortable putting them forward, and when your scores are high, sharing them can give your application an extra boost.
It’s easy to argue that the averages look inflated because only confident test-takers opt in. But, these are the same scores we see at USC’s peer institutions, which means this is the standard now.
| Test | 25th Percentile | 50th Percentile | 75th Percentile |
|---|---|---|---|
| SAT Evidence-Based Reading + Writing | 710 | 740 | 760 |
| SAT Math | 740 | 780 | 790 |
| ACT Composite | 32 | 33 | 35 |
| ACT Math | 29 | 33 | 35 |
| ACT English | 33 | 35 | 35 |
| ACT Science | 31 | 33 | 35 |
| ACT Reading | 33 | 34 | 36 |
First-time, first-year students with scores in each range:
| Score Range | SAT Evidence-Based Reading + Writing | SAT Math |
|---|---|---|
| 700-800 | 83.3% | 90.5% |
| 600-699 | 15.7% | 8% |
| 500-599 | 0.9% | 1.5% |
| 400-499 | 0.1% | 0% |
| Score Range | SAT Composite |
|---|---|
| 1400-1600 | 91.1% |
| 1200-1399 | 7.9% |
| 1000-1199 | 1.1% |
| Score Range | ACT Composite | ACT English | ACT Math | ACT Reading | ACT Science |
|---|---|---|---|---|---|
| 30-36 | 95.1% | 93.4% | 74.7% | 93.6% | 85.2% |
| 24-29 | 4.7% | 5.7% | 24.4% | 5.9% | 14.1% |
| 18-23 | 0.2% | 0.9% | 0.7% | 0.5% | 0.7% |
Standardized Test Score Takeaways:
The typical admitted + enrolled USC student is scoring a 1500+ or 34+
USC has more variance in scores than their peer institutions, but that doesn’t mean a weak score won’t hurt you
The fraction of a percentage of students submitting low scores are the exception, and we have no idea what their circumstances are, so you should assume you will not be the exception
Even with USC continuing to offer a test-optional pathway, the students who choose to report scores at the top end of the admitted group are posting standout scores. The data paints a clear picture, and knowing what you’re up against allows you to plan more strategically.
You see a similar pattern when you look at reported grades as well. 99% of first-time, first year (freshmen) submitted their GPA, and the average high school GPA for all degree-seeking, first-time, first-year (freshmen) students who submitted their GPA was 3.8:
Key GPA Takeaways:
USC has more GPA variance than a lot of similarly competitive schools
While USC boasts an ultra-competitive acceptance, the caliber of admitted students is markedly lower than peer institutions
Anything below a 3.75 will greatly reduce your chance at admission
We have no idea the background of the students submitting less than a 3.0, but you should not strategize your admissions based on that
| GPA Range | Percentage |
|---|---|
| 4.0 | 27.1% |
| 3.75-3.99 | 51% |
| 3.5-3.74 | 15.3% |
| 3.25-3.49 | 4% |
| 3.0-3.24 | 1.6% |
| 2.5-2.99 | 0.7% |
| 2.0-2.49 | 0.3% |
| Class Rank | Percentage |
|---|---|
| Top 10th of HS graduating class | 73% |
| Top Quarter of HS graduating class | 94% |
| Top Half of HS graduating class | 99% |
| Botton Half of HS graduating class | 1% |
| Total submitting class rank | 24% |
Key Class Rank Takeaways:
Most admitted and enrolled students are in their school’s top 10%
Not all schools track and publish rank, so 44% makes sense to us here
Your odds go down significantly the lower your class rank is
We need to talk about the tiny subset of admitted students who show up in lower score bands, like the enrolees with ACT scores in the 20s or unusually low section scores. These cases are the exception, not evidence that the bar is suddenly flexible.
The truth is, we don’t know who those students are or what factors played into their admission. At a school like USC, they might be recruited athletes, first-generation students, applicants from under-resourced high schools, or students with highly unusual circumstances. Outliers exist at every selective institution, but they don’t explain how decisions are made for the overwhelming majority of applicants – and odds are, you’re not one of the outliers.
Early Decision/Early Action
USC only added Early Action a few years ago, and that data is not part of the CDS. We do know from experience that EA and RD have very similar odds for USC hopefuls. It’s less of a strategic thing and more “can you let me know if I got in sooner rather than later.” They also don’t reject students during EA, only defer.
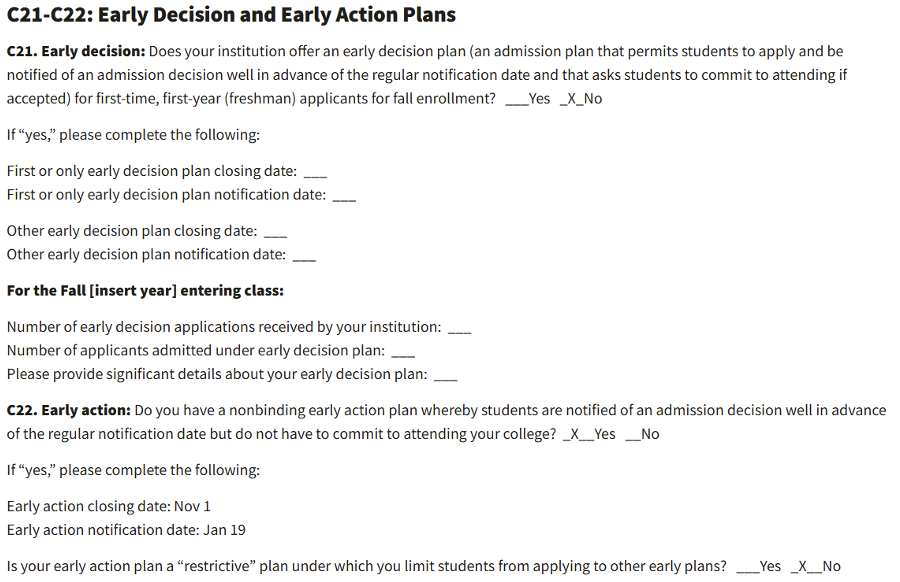
We know that USC added ED for Marshall this last cycle, so hopefully next year we will get to see more concrete data on ED – even if it only is for one college at the school.
Waitlist
USC does not have a waitlist! This may surprise some people, which is totally fair, but in a way – we kind of like that?
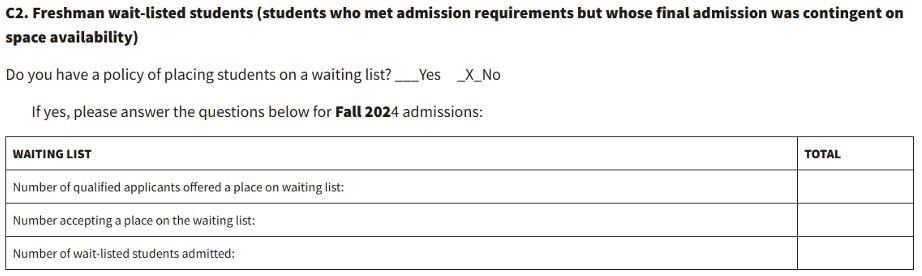
Getting waitlisted is the ultimate in limbo-decisions. We kind of appreciate that they’re very cut and dry, and it frees students up to move onto the next school on their list.
Considerations
This is the section of the Common Data Set where we ditch data and look at all the other things USC cares about. Of course, USC looks closely at tangible academic metrics like GPA and test scores, but those numbers are only part of the picture. On top of them sits a group of broader “considerations” that are far more interpretive. These factors don’t come with a formula or checklist – and they’re also where strategy carries the most weight. Let’s start with the academic side:
| Academic Factors | Very Important | Important | Considered | Not Considered |
|---|---|---|---|---|
| Rigor of secondary school record | X | |||
| Class rank | X | |||
| Academic GPA | X | |||
| Standardized test scores | X | |||
| Application Essay | X | |||
| Recommendation(s) | X |
Key Takeaways for Academic Factors:
Academic performance carries significant weight at USC
Many high schools don’t report class rank, so it's not surprising that it's not considered. But it’s interesting that they include class rank in their data points earlier on in the CDS
Excelling in the most challenging courses your school offers is required
| Nonacademic Factors | Very Important | Important | Considered | Not Considered |
|---|---|---|---|---|
| Interview | X | |||
| Extracurricular Activities | X | |||
| Talent/ability | X | |||
| Character/personal qualities | X | |||
| First generation | X | |||
| Alumni/ae relation | X | |||
| Geographical residence | X | |||
| State residency | X | |||
| Religious affiliation/commitment | X | |||
| Volunteer work | X | |||
| Work experience | X | |||
| Level of applicant's interest | X |
Key Takeaways for Nonacademic Factors:
USC does track demonstrated interest
It’s kind of very weird that nothing here is “very important” to USC and we aren’t sure why they’d categorize things like that
Extracurriculars, who you are as a person, and how you spend time outside of school are all important things to develop
On the nonacademic front, some criteria are fairly black-and-white. Things like where you’re from geographically or whether you’re a first-generation student are simple facts in your file. Others are far more interpretive. Qualities such as talent, character, or personal qualities don’t show up neatly in a data column. Admissions officers infer them by looking at your application holistically, essays, recommendation letters, activity choices, and overall voice. Now, you can be deliberate and strategic in how you present yourself, but you can’t fully script how those traits are read. Ultimately, USC is evaluating fit, which means you should also be asking whether the school’s culture and values genuinely align with yours.
USC also tracks demonstrated interest, and this is one area where you have real control. Sign up for their mailing list and actually engage with their content. Register for a campus tour if possible, or attend a virtual session if travel isn’t realistic. Attend information sessions, whether they’re online or in person, and follow up with your AO with a thoughtful thank-you email. If there aren’t events available near you, reach out to your regional admissions officer with specific, well-researched questions.
This is also where extracurriculars truly start to matter. For applicants who are genuinely competitive at USC, shallow involvement won’t move the needle. The strongest profiles aren’t overloaded with random clubs, scattered leadership titles, or obvious resume padding. Instead, standout students invest deeply in a small number of interests, and their activities reveal how they think, what excites them, and where they’re headed. Depth, continuity, and originality count here – and helping students build that kind of cohesive narrative is exactly what we do every year.
Conclusion
There’s no question that USC is a competitive school. Now, you should have a much sharper sense of what competitiveness at USC actually looks like beyond reputation alone.
That said, admissions decisions aren’t made by spreadsheets. Numbers can show patterns and thresholds, but they can’t fully explain what USC prioritizes, and they definitely can’t fully define you as an applicant. When we work with students, whether they’re applying Early Action, Regular Decision, interested in Marshall, coming in as recruits, or navigating other paths, the strategy is always personalized for each student. Each plan is built intentionally around the student’s unique interests, academic strengths, and long-term goals. There’s no secret shortcut or guaranteed formula for getting into USC, but there are strategic, well-informed choices that can significantly strengthen how your application is read.
One way to increase your odds? Working with college consultants who are experts in the field and have a high rate of success getting students into USC. We help countless students gain admission to top universities every single year – reach out to us today to get started.