During the 2024ŌĆō2025 admissions cycle, Georgetown University admitted only a small fraction of its applicants, with an acceptance rate of 12.9%. That headline figure alone, though, doesnŌĆÖt tell you very much. Where does that number come from? And what factors are actually shaping it? While Georgetown does release portions of its admissions data, understanding whatŌĆÖs really happening requires a closer, more nuanced look. Each year, we analyze admissions data from highly selective institutions to help students better understand the landscape and make smarter, more informed decisions.
So, where are these numbers pulled from? Most colleges and universities in the U.S. complete a standardized report called the , or CDS. The CDS exists to provide outlets such as U.S. News & World Report, the College Board, and PetersonŌĆÖs with consistent, comparable information for rankings and institutional summaries. ItŌĆÖs a dense document with multiple sections, but for our purposes, weŌĆÖre going to zero in on one specific part of : first-time, first-year admissions.
Trend Spotting: Five Years of Georgetown Admissions
Before diving into this most recent cycle, itŌĆÖs helpful to zoom out and look at the broader trajectory at Georgetown. Like many elite universities, Georgetown has seen mostly sustained growth in application volume over time, while its admission rate continues to tighten.
| Year | Total Applicants | Number of Admitted Students | Acceptance Rate | Enrolled | Yield |
|---|---|---|---|---|---|
| 2025 | 26,131 | 3,374 | 12.90% | 1,575 | 46.70% |
| 2024 | 25,485 | 3,334 | 13.08% | 1,599 | 47.90% |
| 2023 | 26,638 | 3,257 | 12.23% | 1,578 | 48.40% |
| 2022 | 27,629 | 3,311 | 11.98% | 1,585 | 47.90% |
| 2021 | 21,190 | 3,561 | 16.81% | 1,592 | 44.70% |
*Denotes our own calculation based on the raw number.
Key Takeaways for Trend Data:
Georgetown is seeing a trend we are seeing at a lot of highly-selective non-Ivy schools: admission numbers surged in the admission cycle during and after Covid, probably because of test optionality, then they started to slow down. But in the 2024-2025 cycle, weŌĆÖre seeing the ultra-competitive numbers come back.
They are switching to the Common App next cycle, which we predict will mean more applicants per year.
To give yourself a real shot, you need to distinguish yourself within an applicant pool packed with academically strong, highly motivated students. Step one is making sure your academic profile clears GeorgetownŌĆÖs high bar ŌĆō because in a pool like this, being ŌĆ£good enoughŌĆØ simply isnŌĆÖt enough.
C1: First-Time, First-Year Admission, Applications
HereŌĆÖs the gender and location breakdown for first-time, first-year applicants during the 2024-2025 cycle:
| First-time, first-year applicants | Total | Admitted | Acceptance rate | Enrolled | Yield rate |
|---|---|---|---|---|---|
| Men | 10,768 | 1,393 | 12.94% | 661 | 47.50% |
| Women | 15,102 | 1,953 | 12.93% | 900 | 46.10% |
| Unknown gender | 261 | 28 | 10.73% | 14 | 50% |
| First-time, first-year applicants | Total | In state | Out of state | International |
|---|---|---|---|---|
| Applied | 26,131 | 244 | 22,272 | 3,615 |
| Admitted | 3,374 | 41 | 3,053 | 280 |
| Acceptance rate | 12.90% | 16.80% | 13.70% | 7.75% |
| Enrolled | 1,575 | 31 | 1,433 | 111 |
| Yield rate | 46.70% | 75.60% | 46.90% | 39.60% |
*Denotes our own calculation based on the raw numbers
Key Takeaways for Acceptance Rates:
An acceptance rate of 12.9% means Georgetown is highly competitive
GeorgetownŌĆÖs yield rate (% of admitted students who enroll) is lower than weŌĆÖd think
Georgetown has a higher international acceptance rate than many of their peer schools
Georgetown is extremely selective! You knew that, or you wouldnŌĆÖt be here. Still, knowing exactly how selective it is matters. You canŌĆÖt build a smart admissions strategy without understanding the numbers youŌĆÖre up against or what successful applicants actually look like.
C9-C2: First-Time, First-Year Profile, or Scores and Grades
Unlike many peer institutions, Georgetown has held firm on their and requires standardized test scores from all applicants. That stance reflects how seriously the university weighs academic performance. While many schools experimented with test-optional policies post-COVID, Georgetown brought them back relatively early.
As a result, submitting strong test scores is mandatory. Rather than guessing or hoping for the best, letŌĆÖs get specific. Below, weŌĆÖll break down what competitive scores typically look like for admitted Georgetown students, so you can see whether your academic profile is truly in range.
Breakdown of enrolled students who submitted scores:
| Percent | Number | |
|---|---|---|
| Submitting SAT Scores | 78% | 1,232 |
| Submitting ACT Scores | 30% | 480 |
| Total Submitting Scores* | 108% | 1,712 |
*Denotes our own calculation based on the raw numbers.
Why This Matters: Some students submitted both SAT and ACT ŌĆō which accounts for the 108%. Many more students submitted the SAT than the ACT, but that doesnŌĆÖt mean Georgetown weighs them differently.
Now, letŌĆÖs take a look at the score breakdowns for each section of the ACT and SAT:
| Test | 25th Percentile | 50th Percentile | 75th Percentile |
|---|---|---|---|
| SAT Composite | 1400 | 1490 | 1540 |
| SAT Evidence-Based Reading + Writing | 700 | 740 | 770 |
| SAT Math | 690 | 750 | 780 |
| ACT Composite | 31 | 33 | 35 |
| ACT Math | 29 | 32 | 34 |
| ACT English | 34 | 35 | 36 |
| ACT Science | 30 | 33 | 35 |
| ACT Reading | 33 | 35 | 36 |
Why This Matters: With middle-50s of 1400-1540 and 31-35, we recommend at least 1500+ or 34+, but 1550+ or 35+ would make you a lot more competitive.
First-time, first-year students with scores in each range:
| Score Range | SAT Evidence-Based Reading + Writing | SAT Math |
|---|---|---|
| 700-800 | 77.92% | 74.68% |
| 600-699 | 16.23% | 17.21% |
| 500-599 | 4.71% | 6.09% |
| 400-499 | 1.14% | 1.95% |
| Score Range | SAT Composite |
|---|---|
| 1400-1600 | 76.06% |
| 1200-1399 | 16.88% |
| 1000-1199 | 5.52% |
| 800-999 | 1.54% |
| Score Range | ACT Composite | ACT English | ACT Math | ACT Reading | ACT Science |
|---|---|---|---|---|---|
| 30-36 | 87.08% | 89.79% | 72.92% | 91.67% | 80.17% |
| 24-29 | 10.21% | 7.92% | 23.33% | 6.25% | 16.49% |
| 18-23 | 2.50% | 1.67% | 2.71% | 2.08% | 3.13% |
| 12-17 | 0.21% | 0.63% | 1.04% | 0% | 0.21% |
Standardized Test Score Takeaways:
The most average Georgetown enrollee has either a 1490 or 33 on their test scores ŌĆō again, thatŌĆÖs the most average of the pool
Since these numbers are based on enrollees and not just admits, it may be fair to assume that other admits have much higher scores, but were one of the ~60% of students who went to other institutions
Submitting less than a 1400 or 30 greatly reduces your chance of admission
You should not assume you can get less than a 1200 or 29 and have an actual serious shot ŌĆō even if a small percentage of students have those stats
To be a realistic contender at Georgetown, your academics need to be very strong ŌĆō think as close to the top of the range as possible. Scores around a 1450 SAT or 34 ACT already land you in the uppermost percentiles nationally, and even those numbers tend to sit toward the lower end of GeorgetownŌĆÖs spectrum. The same story shows up when you look at class rank:
| Class Rank | Percentage |
|---|---|
| Top 10th of HS graduating class | 85% |
| Top Quarter of HS graduating class | 95% |
| Top Half of HS graduating class | 98% |
| Bottom Half of HS graduating class | 2% |
| Total submitting class rank | 51% |
Key Class Rank Takeaways:
Not all schools track class rank, which is why the submission number is 51%
Being in the bottom three-quarters of your HS graduating class greatly reduces your odds
LetŌĆÖs get one thing straight before anyone spirals: the sliver of admits with ACT scores in the low-20s or those sitting well below the top of their graduating class are exceptions, and you shouldnŌĆÖt look at those with rose-colored glasses. Those data points are not an invitation to think, Oh, great, so I still have a chance! In reality, we have no idea who those students are or why they were admitted. Yes, some could be recruited athletes or legacies ŌĆō but others might be first-gen students, applicants from under-resourced schools, refugees, nationally recognized scholars or artists or inventors, or students with truly unusual circumstances. You absolutely cannot build a strategy by trying to reverse-engineer your way into outlier status.
TL;DR: If you want the strongest possible shot at Georgetown, you should be aiming for as perfect-as-possible grades and scores. ThatŌĆÖs the baseline.
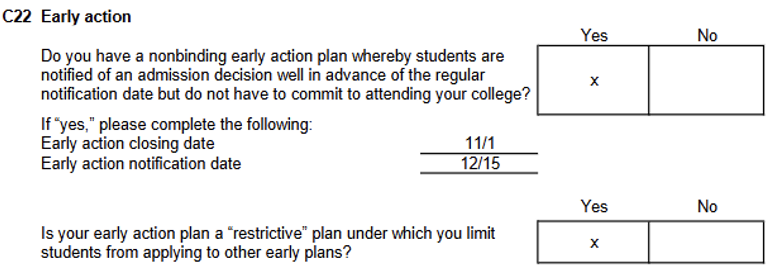
Restricted Early Action
Georgetown doesnŌĆÖt offer a traditional Early Decision option. Instead, they use a Restricted Early Action round, which is non-binding but imposes limits on where else you can apply early. And yes, weŌĆÖre going to say it, weŌĆÖre not huge fans of this setup.
Part of the frustration is transparency. Schools that use EA or REA arenŌĆÖt asked to release the same clear, detailed admissions data that ED schools are in the CDS, which means weŌĆÖre missing a lot of the numbers that actually help students understand their chances.
What we can say is this from : GeorgetownŌĆÖs REA round is extremely competitive and absolutely not a guarantee, and the acceptance rate is speculated to be about the same as their overall acceptance rate. For some students with very strong profiles, it can make sense. For others, especially if thereŌĆÖs a school thatŌĆÖs a better overall fit and offers a binding ED option, REA at Georgetown may not be the smartest first move.
Waitlist
While many colleges keep their waitlist numbers under wraps, Georgetown shares them. Based on firsthand experience and a close look at the data, we can say this: moving off the Georgetown waitlist is challenging, but itŌĆÖs not a lost cause.
| Students placed on waitlist | 2,690 |
|---|---|
| Percent of applicants offered a waitlist spot | 10.29% |
| Students accepting a spot on the waitlist | 2,023 |
| Students admitted off the waitlist | 163 |
| Waitlist acceptance rate | 8.10% |
*Denotes our own calculation based on the raw numbers
Why This Matters: Georgetown doesnŌĆÖt waitlist a huge portion of applicants to begin with, and only a subset of those students ultimately receive offers. Still, ŌĆ£unlikelyŌĆØ is not the same as ŌĆ£never.ŌĆØ
When students receive a waitlist decision, we often see two very different reactions. Some read it as a quiet rejection, while others treat it like a sure-thing delayed acceptance. The truth lives squarely in between. A waitlist outcome means Georgetown believes you could succeed on campus ŌĆō they just donŌĆÖt currently have room. And while space is limited and opens up only in small numbers each year, movement does happen. We help students get off the waitlist at Georgetown and other elite schools every single year.
Considerations
One of the more nuanced sections of the CDS is the list of institutional ŌĆ£considerations.ŌĆØ Sure, there are clear-cut academic metrics, like GPA, course rigor, and test scores. But layered on top are less tangible qualities that donŌĆÖt come with a rubric and canŌĆÖt be perfectly engineered. In our view, this gray area is where your strategy really comes into play. First, letŌĆÖs look at the academic considerations:
| Academic Factors | Very Important | Important | Considered | Not Considered |
|---|---|---|---|---|
| Rigor of secondary school record | X | |||
| Class rank | X | |||
| Academic GPA | X | |||
| Standardized test scores | X | |||
| Application Essay | X | |||
| Recommendation(s) | X |
Key Takeaways for Academic Factors:
Everything is very important to Georgetown
Not every HS publishes class rank, so if you donŌĆÖt have it, donŌĆÖt worry too much
Getting the best possible grades in the hardest classes your school offers is mandatory
| Nonacademic Factors | Very Important | Important | Considered | Not Considered |
|---|---|---|---|---|
| Interview | X | |||
| Extracurricular activities | X | |||
| Talent/ability | X | |||
| Character/personal qualities | X | |||
| First generation | X | |||
| Alumni/ae relation | X | |||
| Geographical residence | X | |||
| State residency | X | |||
| Religious affiliation/commitment | X | |||
| Volunteer work | X | |||
| Work experience | X | |||
| Level of applicantŌĆÖs interest | X |
Key Takeaways for Nonacademic Factors:
Georgetown does NOT track demonstrated interest
Talent/ability and character/personal qualities are extremely subjective
You donŌĆÖt have control over things like first-gen, alum relatives, where you live ŌĆō but you have control over your extracurriculars and how you spend time outside of school.
Some nonacademic factors are pretty straightforward, like geographic background or legacy status. Those are largely outside your control, so we donŌĆÖt recommend fixating on them. Others, the things like ŌĆ£characterŌĆØ or ŌĆ£talents,ŌĆØ are far more interpretive. Admissions officers are piecing them together from essays, recommendations, and the overall vibe of an application. ThereŌĆÖs no one set formula here, but alignment with Georgetown matters. You want your values, interests, and perspective to match the school, so we recommend taking some time to seriously consider whether or not youŌĆÖre a true Hoya before pinning all your hopes on Georgetown.
And yes, weŌĆÖre going to push back a bit on the idea that extracurriculars are merely ŌĆ£importantŌĆØ at Georgetown. In our opinion, extracurriculars and how you spend time outside of school is probably the number one way to differentiate yourself. For truly competitive applicants, surface-level involvement isnŌĆÖt what makes the difference. The strongest candidates arenŌĆÖt collecting clubs or titles for the sake of it. TheyŌĆÖre investing deeply in a few meaningful pursuits that clearly tie back to their academic interests and long-term goals. Helping students craft those kinds of distinctive, high-impact profiles is quite literally what we do year after year.
Conclusion
ThereŌĆÖs no denying that Georgetown is a tough school to get into! ThatŌĆÖs not breaking news, but now you have clearer context for what the competitive landscape actually looks like when youŌĆÖre aiming for a school like this.
Still, raw numbers only explain part of the picture. Admissions data canŌĆÖt fully capture GeorgetownŌĆÖs institutional priorities, and it certainly doesnŌĆÖt account for who you are as a person or what you bring to a campus community. When we advise students, whether theyŌĆÖre legacies, applying REA, navigating recruitment, or submitting Regular Decision, we donŌĆÖt rely on a one-size-fits-all strategy. Every plan is shaped around the individual student: their interests, strengths, intellectual curiosity, and long-term goals. ThereŌĆÖs no universal blueprint for getting into Georgetown, and successful applicants donŌĆÖt all follow the same path. The goal is to build your own path, and weŌĆÖre here to help you do exactly that.
One way to increase your odds? Working with college consultants who are experts in the field and have a high rate of success getting students into Georgetown. We help countless students gain admission to top universities every single year ŌĆō reach out to us today to get started.