During the 2024ŌĆō2025 admissions cycle, UT Austin reported an acceptance rate of 26.6%. But a single percentage doesnŌĆÖt actually explain very much on its own. How is that figure calculated? And what forces keep pushing it lower over time? While UT releases some admissions information publicly, getting a real sense of whatŌĆÖs happening requires a closer, more intentional look. ThatŌĆÖs exactly why we break down this data every year ŌĆō to help students approach competitive admissions with clear expectations, practical insight, and a smart plan.
To do that, we start with a familiar tool: the , or CDS. Most colleges and universities in the U.S. complete this report to standardize how they share information with organizations like U.S. News & World Report, the College Board, and PetersonŌĆÖs. The CDS includes a wide range of data points, but for our purposes, weŌĆÖre going to focus on one specific slice of : first-time, first-year admissions.
Trend Spotting: Five Years of UT Admissions
Before zeroing in on the most recent cycle, itŌĆÖs useful to step back and look at UT AustinŌĆÖs bigger admissions picture. Over time, application volume has surged, while admission rates have continued to tighten.
| Year | Total Applicants | Number of Admitted Students | Overall Acceptance Rate* |
|---|---|---|---|
| 2025 | 72,885 | 19,417 | 26.60% |
| 2024 | 69,109 | 19,253 | 27.90% |
| 2023 | 59,260 | 18,770 | 31.70% |
| 2022 | 66,043 | 18,989 | 28.80% |
| 2021 | 57,241 | 18,291 | 31.90% |
*Denotes our own calculation based on the raw numbers.
Why This Matters: Gaining admission is becoming increasingly difficult each year as demand keeps rising and available seats remain limited.
When you apply to UT Austin, youŌĆÖre competing with tens of thousands of applicants who look impressive on paper. You have to make strategic moves, especially as an out-of-state student, to stand out.
C1: First-Time, First-Year Admission, Applications
LetŌĆÖs break down the numbers further, including how applications shake out by geography and gender:
| First-time, first-year applicants | Total | Admitted | Acceptance Rate | Enrolled | Yield rate |
|---|---|---|---|---|---|
| Men | 35,912 | 8,101 | 22.60% | 3,847 | 47.50% |
| Women | 36,750 | 11,264 | 30.70% | 5,343 | 47.40% |
| Unknown Gender | 223 | 52 | 23% | 20 | 38.50% |
| Total | 72,885 | 19,417 | 26.60% | 9,210 | 47.40% |
*Denotes our own calculation based on the raw numbers.
| First-time, first-year applicants | Total | In-state | Out-of-state | International |
|---|---|---|---|---|
| Applied | 72,885 | 42,926 | 23,015 | 6,944 |
| Percent of total applicant pool | n/a | 58.90% | 31.60% | 9.50% |
| Admitted | 19,417 | 16,191 | 2,332 | 894 |
| Acceptance Rate | 26.64% | 37.70% | 10.10% | 12.90% |
| Enrolled | 9,210 | 8,048 | 769 | 393 |
| Yield Rate | 47.43% | 49.70% | 32.90% | 43.90% |
| Percent of incoming class | n/a | 87.40% | 8.30% | 4.30% |
*Denotes our own calculation based on the raw numbers
Key Takeaways for Acceptance Rates:
In-state admission makes up for the vast majority of applicants, acceptances, and enrollees ŌĆō probably because UT offers auto-admission for the top 6% of TX public schools, as long as they apply
Even among top state schools, 87.4% of a class being in-state is very high and unusual
A lower out-of-state admission rate than international admission rate is very rare
Yield rates are lower than expected, but that is probably because many students apply to UT as a target or safety
UT is a highly competitive school ŌĆō especially for out-of-state applicants. What is important, though, is moving past reputation and instinct and grounding your strategy in facts. Without concrete reference points or transparency around who actually gets admitted, itŌĆÖs much harder to evaluate how competitive your profile really is or make intentional decisions about how to apply.
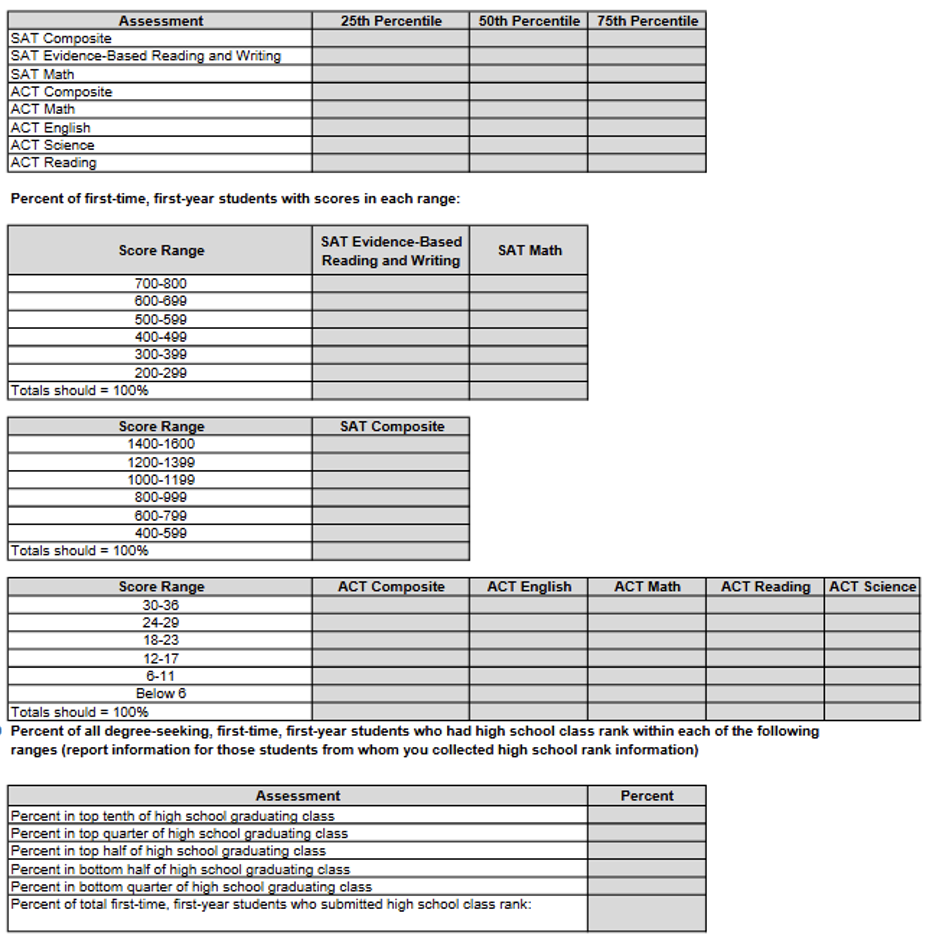
C9-C2: First-Time, First-Year Profile, or Scores and Grades
Unlike many schools that have gone back and forth on testing, UT requires standardized test scores. This shift reflects a broader trend across higher education: colleges are paying closer attention to how students perform once theyŌĆÖre on campus, and many have found that students admitted without scores tend to struggle more academically than their score-submitting peers. That concern has pushed schools like UT to re-embrace testing.
However, UT does not release detailed data on admitted studentsŌĆÖ grades or test scores, which means applicants are left without the usual benchmarks ŌĆō making strategic planning even more important.
Yes girl, give us nothing!
Ah, a complete lack of data. Thanks soooo much, UT. This is really helpful for students and parents and counselors. Can we ask you a question: why are you being like this? Are your admitted and accepted grades and scores not as high as you want them to be so youŌĆÖre being intentionally withholding so as to seem more competitive?
What we can tell you, from experience, is that being a competitive out-of-state applicant requires the highest grades and scores possible. You will want to aim for 1500+ and 34+, and a GPA as close to 4.0 as humanly possible.
Early Action
UT offers Early Action, sometimes called priority admission, and they arenŌĆÖt required to release numbers on these stats.
Once again, UT, come on my dude. Take a page out of MITŌĆÖs book and release all the info. More data helps kids and families make better and more informed decisions.
We do know that in the last two cycles, so many students applied EA that the UT admissions department justŌĆ” ran out of time to review them all. This meant they auto-deferred all the students they couldnŌĆÖt get to in time, and because of this, they got rid of deferral letters, too.
Considerations
This is the section of the Common Data Set where things get less clean and a lot more interpretive. UT absolutely looks at concrete academic indicators like coursework, grades, and required test scores, but those are only part of the evaluation. Especially in a pool of tens of thousands of applicants. Layered on top is a set of broader ŌĆ£considerationsŌĆØ that donŌĆÖt come with a scoring guide or formula. These are the harder-to-define elements, and frustratingly, theyŌĆÖre also where strategy plays the biggest role. LetŌĆÖs start with the academic side:
| Academic Factors | Very Important | Important | Considered | Not Considered |
|---|---|---|---|---|
| Rigor of secondary school record | X | |||
| Class rank | X | |||
| Academic GPA | X | |||
| Standardized test scores | X | |||
| Application Essay | X | |||
| Recommendation(s) | X |
Key Takeaways for Academic Factors:
Everything is simply ŌĆ£consideredŌĆØ
Not all high schools report class rank, so the absence of it wonŌĆÖt hurt you
Since everything is just ŌĆ£considered,ŌĆØ you should treat them all as very important
| Nonacademic Factors | Very Important | Important | Considered | Not Considered |
|---|---|---|---|---|
| Interview | X | |||
| Extracurricular activities | X | |||
| Talent/ability | X | |||
| Character/personal qualities | X | |||
| First generation | X | |||
| Alumni/ae relation | X | |||
| Geographical residence | X | |||
| State residency | X | |||
| Religious affiliation/commitment | X | |||
| Volunteer work | X | |||
| Work experience | X | |||
| Level of applicantŌĆÖs interest | X |
Key Takeaways for Nonacademic Factors:
UT does not track demonstrated interest
UT does not care about legacy status
With everything else as ŌĆ£considered,ŌĆØ you should treat them as very important for your own sake
Some of UTŌĆÖs nonacademic factors are easy to identify. Details like where youŌĆÖre from geographically or whether youŌĆÖre a first-generation student are straightforward facts in your file. Others are much more subjective. Qualities like character, intellectual curiosity, or talent arenŌĆÖt things you can quantify. Admissions officers infer them by looking holistically at your application ŌĆō essays, recommendation letters, your story, activity choices, and overall voice. You can be deliberate about how you present yourself, but you canŌĆÖt fully control how those traits are interpreted. At the end of the day, UT is assessing fit, which means you should also be asking whether your interests and values genuinely align with the campus culture.
This is also where extracurriculars start to carry real weight, just not in the way many students assume. For applicants who are genuinely competitive at UT, surface-level involvement wonŌĆÖt move the needle. The strongest applications arenŌĆÖt stuffed with random clubs, a few sports, and resume padding. Instead, standout students go deep in a small number of pursuits, often in ways that feel intentional, authentic, and sometimes a bit unconventional. Their activities form a clear narrative about what excites them, how they think, and what drives them. Sustained commitment and originality matter here, and helping students build that kind of cohesive profile is something we do year after year.
Conclusion
ThereŌĆÖs no question that UT Austin is a highly selective institution. By now, you should have a much clearer, more realistic sense of what competitiveness at UT actually looks like, beyond reputation alone.
That said, admissions decisions canŌĆÖt be boiled down to charts, thresholds, or cutoffs. Data helps reveal patterns, but it doesnŌĆÖt fully capture UTŌĆÖs priorities, and it certainly doesnŌĆÖt define you as an individual applicant. When we work with students, whether theyŌĆÖre applying Early Action, Regular Decision, or navigating more complex pathways like recruitment or honors college applications, our approach is never one-size-fits-all. Each strategy is built around the studentŌĆÖs specific strengths, interests, and goals. ThereŌĆÖs no guaranteed formula for getting into UT, but there are thoughtful choices that can significantly strengthen how your application is read.
One way to increase your odds? Working with college consultants who are experts in the field and have a high rate of success getting students into UT. We help countless students gain admission to top universities every single year ŌĆō reach out to us today to get started.