During the 2024–2025 admissions cycle, New York University had a 9.23% acceptance rate – its lowest ever. However, this one data point doesn’t tell the whole story. How is that figure calculated? What’s actually driving it lower? And, importantly, what does this mean for YOU? While NYU releases some headline admissions data, understanding what’s really going on requires a closer look. We break down this kind of data every year to help our students approach competitive admissions with clarity and strategy.
Most colleges and universities in the U.S. complete the , a standardized report designed to give organizations like U.S. News & World Report, the College Board, and Peterson’s consistent, reliable information for rankings and comparisons. The CDS covers a wide range of topics, but for our purposes, we’re going to zoom in on one specific section of : Section C, or first-time, first-year admissions.
Trend Spotting: Five Years of NYU Admissions
Before zeroing in on this most recent cycle, it’s important to step back and look at the larger pattern taking shape at NYU. Like most top universities, NYU has seen application volume steadily climb while admission rates continue to lower.
| Year | Total Applicants | Number of Admitted Students | Acceptance Rate* |
|---|---|---|---|
| 2025 | 110,807 | 10,232 | 9.23% |
| 2024 | 113,574 | 10,689 | 9.41% |
| 2023 | 100,662 | 12,539 | 12.46% |
| 2022 | 95,517 | 12,380 | 12.96% |
| 2021 | 80,210 | 16,918 | 21.10% |
*Denotes our own calculation based on the raw numbers
Why This Matters: NYU has quickly become one of the most competitive schools in the last 5, 10, and 15 years of admissions history. These are some of the highest number of applicant growth in a top tier school.
To give yourself the strongest possible shot, you need to be prepared to stand out in an applicant pool of well over 100k students. A hundred! Thousand! That is so many! Meeting the academic bar is only the starting point, and strategy is what will separate you from the crowd.
C1: First-Time, First-Year Admission, Applications
Let’s look at the specific data breakdowns for 2024-2025 admissions:
| First-time, first-year applicants | Total | Admitted | Acceptance rate | Enrolled | Yield rate |
|---|---|---|---|---|---|
| Men | 45,100 | 4,097 | 9.08% | 2,353 | 57.40% |
| Women | 65,707 | 6,135 | 9.34% | 3,313 | 54% |
| Total | 110,807 | 10,232 | 9.23% | 5,666 | 55.40% |
*Denotes our own calculation based on the raw numbers
Key Takeaways for Acceptance Rates:
Many more women apply to and get into NYU than men
Men have a slightly lower admission rate – not a common trend we see when women’s applications vastly outnumber men’s applications
NYU’s yield rate is a bit higher than we expected—but still in the mid-range for a school that wants to be “top tier”
NYU is pretty hard to get into! This might actually surprise some people – especially parents, but it’s become one of the most sought-after schools in the country. Now, let’s talk about the academic standards you need to hit to be a competitive applicant
C9-C2: First-Time, First-Year Profile, or Scores and Grades
NYU remained test-optional for the 2025-2026 season, but no word yet on what next year’s cycle will be. Across higher education, colleges are taking a harder look at how students fare once they’re actually on campus, and a growing body of evidence suggests that students who enroll without submitting scores tend to struggle academically at higher rates than their score-submitting peers. That trend has already pushed some universities back toward test requirements, while others, like NYU, are still on the fence.
That said, “optional” doesn’t mean you shouldn’t submit. Even without a mandate, the admissions data is still very revealing. By examining how many applicants choose to submit scores, and how strong those scores are, we can get a clearer picture of how NYU assesses academic preparedness and where competitive applicants tend to land.
| Percent | Number | |
|---|---|---|
| Submitting SAT Scores | 28% | 1,598 |
| Submitting ACT Scores | 10% | 583 |
| Total* | 38% | 2,181 |
*Denotes our own calculation based on the raw numbers
Why This Matters: While a majority of students didn’t submit scores, a large portion did. Those students probably had an advantage over students who did not include their standardized scores.
| Test | 25th Percentile | 50th Percentile | 75th Percentile |
|---|---|---|---|
| SAT Composite | 1480 | 1520 | 1550 |
| SAT Evidence-Based Reading + Writing | 720 | 740 | 760 |
| SAT Math | 760 | 780 | 800 |
| ACT Composite | 34 | 34 | 35 |
First-time, first-year students with scores in each range:
| Score Range | SAT Evidence-Based Reading + Writing | SAT Math |
|---|---|---|
| 700-800 | 89% | 95% |
| 600-699 | 10% | 4% |
| 500-599 | 1% | 1% |
| Score Range | ACT Composite |
|---|---|
| 30-36 | 98% |
| 24-29 | 2% |
Standardized Test Score Takeaways:
The average NYU enrollee is scoring a 1520+ or 34+ on their standardized tests
Students with section scores under 700 for the SAT and 30 for the ACT have incredibly low chances of being admitted to NYU, and we’d wager that bar is actually higher
You could say the averages look inflated because only top scorers bother reporting results. For NYU, being a genuinely competitive applicant usually means testing in the neighborhood of a 1500+ SAT or a 34+ ACT. It’s a high bar, but we’re not pointing it out to intimidate you. We’re just being honest about what the data shows.
| GPA Range | Percentage |
|---|---|
| 4 | 18% |
| 3.75-3.99 | 54% |
| 3.5-3.74 | 22% |
| 3.25-3.49% | 5% |
| 3.0-3.24 | 1% |
| Average high school GPA of all degree-seeking, first-time, first-year (freshman) students who submitted GPA: | 3.81 |
|---|---|
| Percent of total first-time, first-year (freshman) students who submittedhigh school GPA: | 99% |
Key GPA Takeaways:
A less-than-perfect GPA is not a deal breaker – but anything lower than a 3.75 is going to be challenging
The highest percentage of enrolled students having a 3.75-3.99 indicates to us that this is the sweet spot for their yield, and 4.0 students most likely do not accept their offers to attend
Lower enrollee GPAs, like 3.0-3.5, are the exception, not the rule
Now, let’s clear something up. The sliver of admits with ACT scores in the mid-to-high 20s, or the small percentage with GPAs in the low-to-mid 3s, are anomalies. You are most likely not an anomaly (harsh, we know, but also true).
The truth is, we have no idea who those students are or why they were admitted. They might be first-generation students, applicants from under-resourced schools, refugees, or individuals with truly extraordinary achievements or unbelievably challenging circumstances. Sure, exception cases exist, but they tell you almost nothing about how admissions works for the vast majority of applicants, and you should never plan your strategy around being the exception.
Early Decision
NYU unfortunately does not publish their ED data:
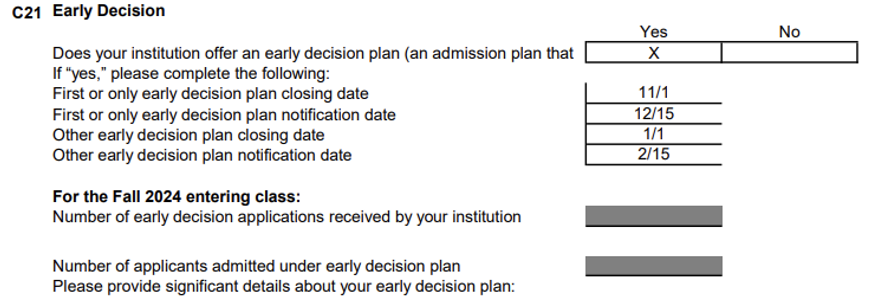
What we can tell you, from experience, is that NYU ED has a significant advantage over RD. NYU also offers ED2, which tells us they do care about early applicants – especially since they positively contribute to their yield rate. If you have a strong academic profile, and want to go to NYU, it’s worth applying ED to NYU. We do wonder why NYU doesn’t release this data. More data is always more helpful to students and families, which NYU knows, so we are curious why they are choosing to be so ~mysterious and elusive~.
Waitlist
NYU also does not publish waitlist data. They have a waitlist, but they’re not giving us any of the numbers:
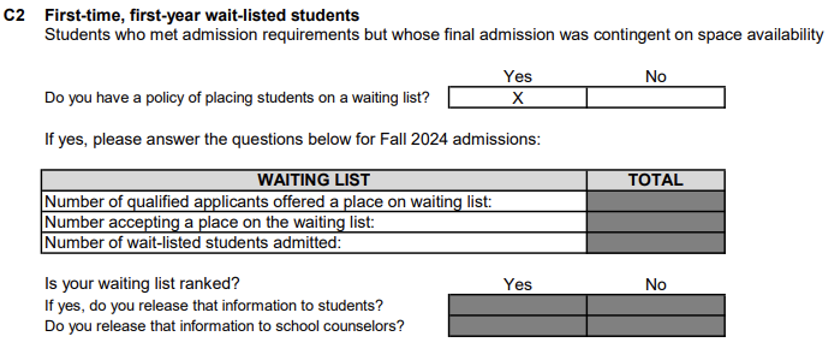
Why This Matters: Getting off the NYU waitlist is hard, and even without hard stats, we know it’s possible. We help students do it every year.
NYU offers many paths to admission, and we commonly see our students get into NYU off the waitlist and into more niche programs, like Global Liberal Studies or a first-year abroad. But truly, @NYU, release the data. Give the kids something. The uncertainty makes them so anxious, and even if the chance is 3% (for the record, we think it is higher), it’ll allow them to calibrate their expectations.
Considerations
One of the least concrete sections of the Common Data Set is the list of “considerations” a school weighs when reading applications. Some of these are easy to pin down and describe, like where you live, GPA, and test scores. Others live in much murkier territory, falling under nonacademic qualities that are harder to define, measure, or predict. And the reality is, that’s where most of the strategy lies.
| Academic Factors | Very Important | Important | Considered | Not Considered |
|---|---|---|---|---|
| Rigor of secondary school record | X | |||
| Class rank | X | |||
| Academic GPA | X | |||
| Standardized test scores | X | |||
| Application Essay | X | |||
| Recommendation(s) | X |
Key Takeaways for Academic Factors:
Getting the best grades possible in the hardest classes your school offers is crucial
When you do submit test scores, they will be taken seriously – which is why we recommend doing well and submitting!
Not all high schools track or publish class rank, which is probably why it’s not considered
| Nonacademic Factors | Very Important | Important | Considered | Not Considered |
|---|---|---|---|---|
| Interview | X | |||
| Extracurricular activities | X | |||
| Talent/ability | X | |||
| Character/personal qualities | X | |||
| First generation | X | |||
| Alumni/ae relation | X | |||
| Geographical residence | X | |||
| State residency | X | |||
| Religious affiliation/commitment | X | |||
| Volunteer work | X | |||
| Work experience | X | |||
| Level of applicant’s interest | X |
Key Takeaways for Nonacademic Factors:
NYU does track demonstrated interest
NYU does not care about legacy status
Character/personal qualities are best expressed in essays (we rule at this)
These should be taken with a grain of salt – these are hard to quantify and all factors besides those “not considered” should be taken extremely seriously
As you can see, NYU’s nonacademic criteria range from the relatively concrete to the highly interpretive. Factors like geographic location are easy enough to identify. Others, especially qualities like “character,” are far more subjective. Admissions officers are likely piecing these together from essays, recommendation letters, and the overall narrative of an application, but there’s no one, clean, set formula to crack it. That’s where we come in! We can help you shape the path that works for you.
We also disagree that extracurriculars are merely “considered” at NYU. For applicants who are genuinely competitive, what distinguishes them isn’t surface-level involvement – you have to go deeper. The strongest candidates aren’t just joining a few clubs, running for student government, or playing a sport because they think they should. They’re building focused, often unconventional niche pursuits that clearly connect to their academic interests, goals, and long-term direction. That kind of depth is what separates one strong applicant from another – and it’s exactly the kind of profile we help students craft year after year.
Conclusion
There’s no question that NYU is a highly selective school – and it’s only getting harder to get into. That’s not new information, but now you have clearer benchmarks and context to understand what competitiveness actually looks like for their applicant pool.
At the same time, numbers only tell part of the story. Data can highlight trends and thresholds, but it can’t fully capture NYU’s priorities, and it certainly can’t define you. When we advise students, whether they’re applying ED, coming through RD or ED2, or navigating other paths, the strategy we build is never one-size-fits-all. Our guidance is shaped around each student’s individual interests, strengths, and goals. There’s no single, guaranteed path into NYU. But there are smart, strategic steps you can take to give yourself the strongest possible shot.
One way to increase your odds? Working with college consultants who are experts in the field and have a high rate of success getting students into NYU. We help countless students gain admission to top universities every single year – reach out to us today to get started.